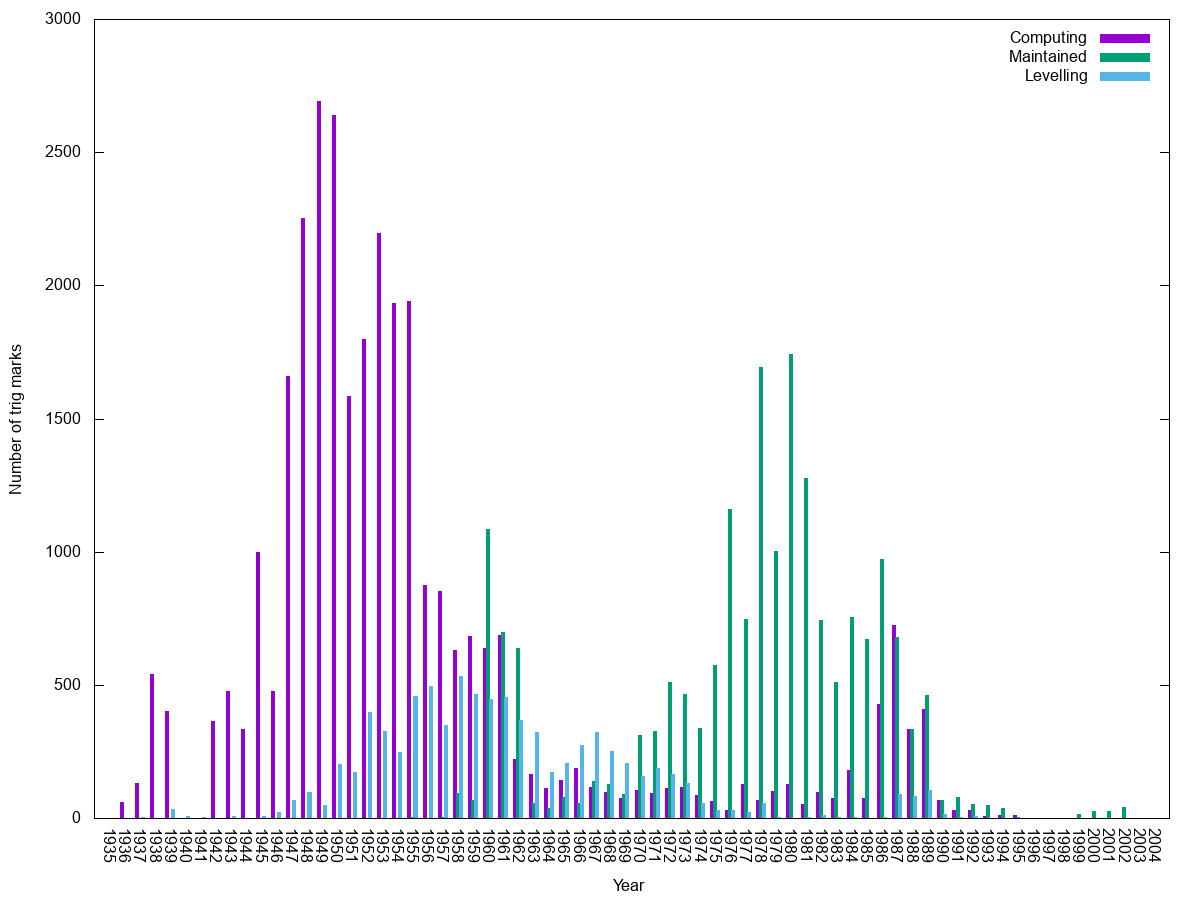
Trigs timeline
From TrigpointingUK
| Year | Computed | Maintained | Levelling |
|---|---|---|---|
| 1935 | 0 | 0 | 0 |
| 1936 | 60 | 0 | 1 |
| 1937 | 133 | 0 | 3 |
| 1938 | 540 | 0 | 1 |
| 1939 | 400 | 0 | 34 |
| 1940 | 0 | 0 | 9 |
| 1941 | 0 | 0 | 3 |
| 1942 | 365 | 0 | 1 |
| 1943 | 476 | 0 | 9 |
| 1944 | 334 | 0 | 0 |
| 1945 | 997 | 0 | 7 |
| 1946 | 475 | 0 | 23 |
| 1947 | 1659 | 0 | 68 |
| 1948 | 2253 | 1 | 97 |
| 1949 | 2693 | 0 | 48 |
| 1950 | 2638 | 1 | 201 |
| 1951 | 1583 | 0 | 172 |
| 1952 | 1799 | 0 | 398 |
| 1953 | 2195 | 1 | 327 |
| 1954 | 1933 | 1 | 246 |
| 1955 | 1941 | 2 | 459 |
| 1956 | 876 | 0 | 497 |
| 1957 | 851 | 2 | 351 |
| 1958 | 629 | 95 | 534 |
| 1959 | 685 | 68 | 467 |
| 1960 | 638 | 1085 | 446 |
| 1961 | 686 | 698 | 456 |
| 1962 | 222 | 639 | 369 |
| 1963 | 164 | 57 | 324 |
| 1964 | 114 | 36 | 173 |
| 1965 | 143 | 79 | 208 |
| 1966 | 187 | 57 | 275 |
| 1967 | 116 | 140 | 324 |
| 1968 | 96 | 128 | 252 |
| 1969 | 75 | 89 | 206 |
| 1970 | 106 | 310 | 156 |
| 1971 | 95 | 327 | 189 |
| 1972 | 111 | 511 | 165 |
| 1973 | 115 | 467 | 131 |
| 1974 | 86 | 337 | 55 |
| 1975 | 65 | 576 | 31 |
| 1976 | 31 | 1159 | 30 |
| 1977 | 127 | 748 | 21 |
| 1978 | 69 | 1695 | 57 |
| 1979 | 101 | 1003 | 3 |
| 1980 | 128 | 1744 | 0 |
| 1981 | 51 | 1275 | 5 |
| 1982 | 97 | 742 | 12 |
| 1983 | 76 | 509 | 5 |
| 1984 | 179 | 753 | 4 |
| 1985 | 76 | 672 | 0 |
| 1986 | 427 | 971 | 4 |
| 1987 | 723 | 678 | 89 |
| 1988 | 334 | 335 | 84 |
| 1989 | 410 | 463 | 107 |
| 1990 | 67 | 66 | 15 |
| 1991 | 29 | 79 | 3 |
| 1992 | 30 | 53 | 8 |
| 1993 | 8 | 47 | 1 |
| 1994 | 11 | 36 | 0 |
| 1995 | 11 | 4 | 0 |
| 1996 | 0 | 0 | 0 |
| 1997 | 0 | 0 | 0 |
| 1998 | 0 | 1 | 0 |
| 1999 | 0 | 15 | 0 |
| 2000 | 0 | 27 | 0 |
| 2001 | 0 | 27 | 0 |
| 2002 | 0 | 40 | 0 |
| 2003 | 0 | 0 | 0 |
| 2004 | 0 | 0 | 0 |
